

On-chain shows Bitcoin miner outflows have been elevated recently, suggesting miners were involved in the recent selloff that took the price of the crypto below $42k.
Bitcoin Miner Outflows Spiked Up Before The Crash Below $42k
As pointed out by an analyst in a CryptoQuant post, BTC miners seem to have been one of the sellers behind the price drop to $42k.
The relevant indicator here is the “miner outflow,” which measures the total amount of Bitcoin exiting wallets of all miners.
When the value of this metric spikes up, it means miners are moving a large number of coins out of their wallets right now. Such a trend can be bearish for the price of the crypto as it may be a sign of dumping from these original whales.
Related Reading | Ark CEO Cathie Wood Is As Bullish As Ever, Sees Bitcoin Hitting $1 Million By 2030
On the other hand, low values of these outflows suggest a normal or healthy amount of selling from miners. This trend, when sustained, can prove to be bullish for the BTC price.
Now, here is a chart that shows the trend in the Bitcoin miner outflows over the past several months:
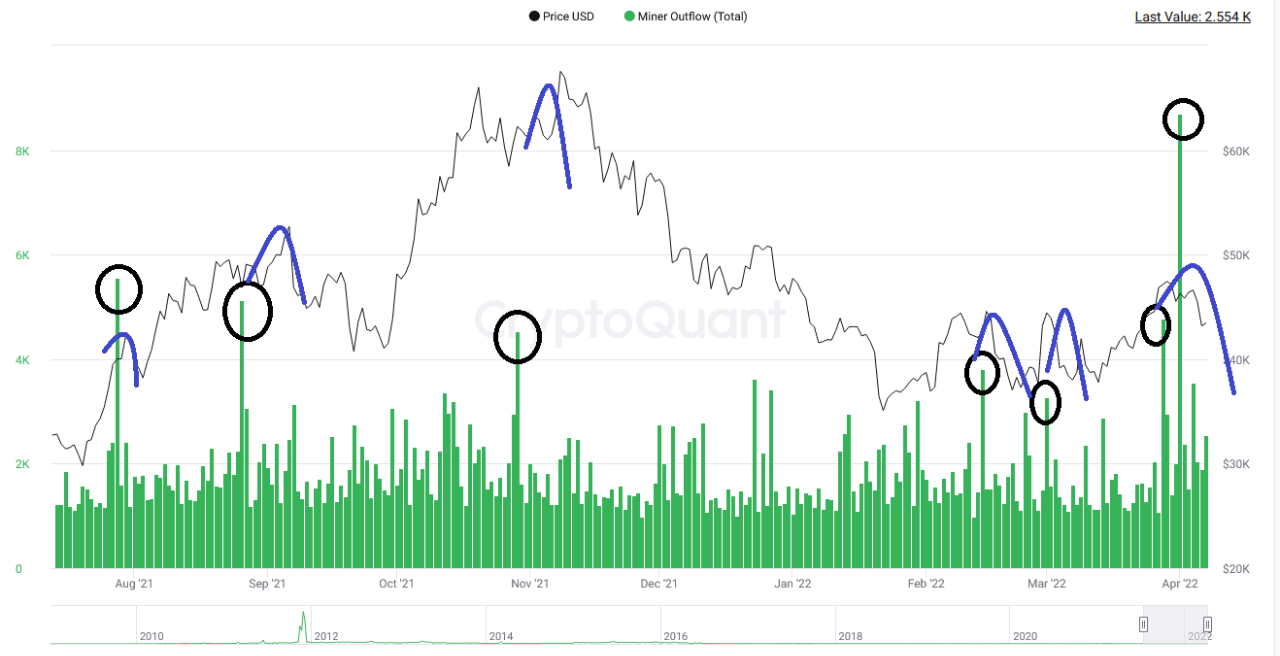
Looks like the value of the indicator has shot up recently | Source: CryptoQuant
As you can see in the above graph, the Bitcoin miner outflows seem to have shown spikes in recent weeks, just before the selloff.
This would suggest that miners look to have played a role in the dump recently, sending the price of the coin diving below the $42k level.
A trend like this has been observed a few times in the past several months already, as the quant has marked in the chart.
Related Reading | Mexico’s Third Richest Man Says No To Bonds, Yes To Bitcoin
Currently, it’s unclear whether Bitcoin miners have already calmed down or if more selling is coming in the next few days.
BTC Price
After around twenty days of holding strongly above the level, Bitcoin’s price is now once again revisiting the $41k mark.
At the time of writing, the coin’s price floats around $41.1k, down 11% in the last seven days. Over the past month, the crypto has gained 4% in value.
The below chart shows the trend in the price of BTC over the last five days.

The value of BTC seems to have taken a plunge over the past twenty-four hours | Source: BTCUSD on TradingView
Due to this sharp downtrend in the price of the coin as well as the wider market, crypto futures has collected a huge amount of liquidations today. In the last 24 hours, liquidations have amounted to more than $322 million, $175 million of which occurred in the past 4 hours alone.
Featured image from Unsplash.com, charts from TradingView.com, CryptoQuant.com
